|
|
|
|
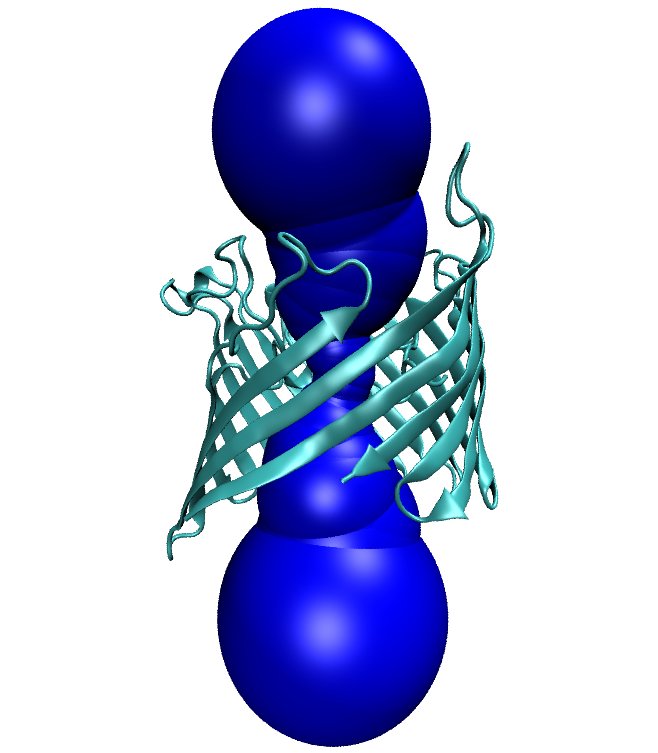
| 1. Download from the PDB website the file with code 1PRN.
| |
| 2. Run molaxis init -pdb 1prn.pdb -e 0.1 -type channel
-channel_via 2.817 39.232 34.308 1 -channel_z 0 0 1 -outer_sphere 30. Two
files created: 1prn.pma and 1prn.stats_init files.
| |
| 3. Run VMD (preferably version 1.8.4 or higher) from the directory
containing the pdb file and load the PDB file.
| |
4. Open tcl console by Extensions->TK Console and run:
source MOLAXIS_PATH/root/script/molaxis.tcl.
| |
| 5. In the TK Console run MolAxis::view command main.
| |
| 6. Run molaxis graph -pdb 1prn.pdb -graph_type z
-graph_main.
Two files are created: 1prn.graph_main and 1prn.graph_main_bottle.
| |
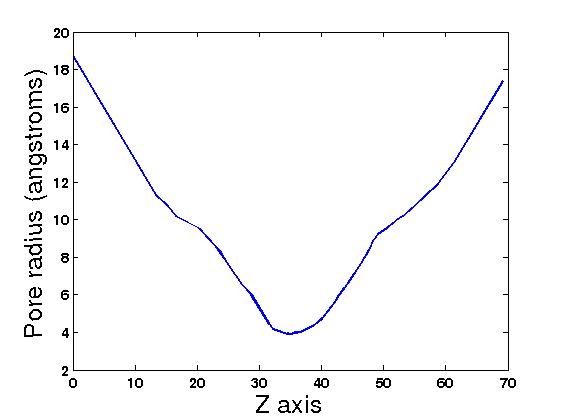
| 7. You can create the channel graph with programs like MathLab or gnuplot
using the file: 1prn.graph_main
| |
| * You should get similar figures similar to the following:
| |
|
|
|
|
|
|
|
|
| 1. Download from the PDB website the file with code 2NQ2.
| |
| 2. Run molaxis init -pdb 2nq2.pdb -e 0.1 -type channel
-channel_via 18 -14.5 40.5 4 -channel_z 36 -40 20 -outer_sphere 35.
Two files created: 2nq2.pma and 2nq2.stats_init files.
| |
| 3. Run VMD (preferably version 1.8.4 or higher) from the directory
containing the pdb file and load the PDB file.
| |
4. Open tcl console by Extensions->TK Console and run:
source MOLAXIS_PATH/root/script/molaxis.tcl.
| |
| 5. In the TK Console run MolAxis::view command main disp_radius
7.
| |
| 6. Run molaxis graph -pdb 2nq2.pdb -graph_type z
-graph_main.
Two files are created: 2nq2.graph_main and 2nq2.graph_main_bottle
| |
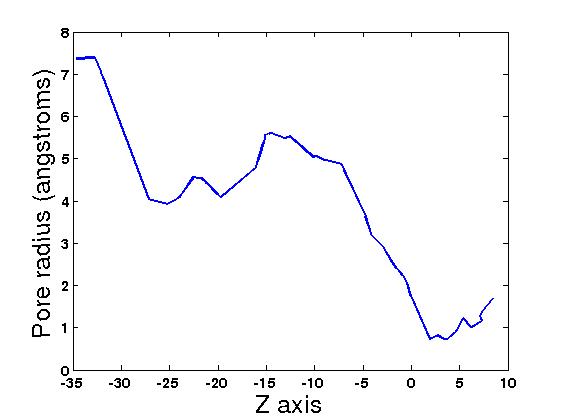
| 7. You can create the channel graph with programs like MathLab or gnuplot
using the file: 2nq2.graph_main
| |
| * You should get similar figures similar to the following:
| |
|
|
|
|
|
Human Cytochrome P450 Enzymes
|
|
|
|
| 1. Download from the PDB web site the file with code 1W0E.
| |
| 2. Run molaxis init -pdb 1w0e.pdb -e 0.3 -rm
void -hetatoms HEM -outer_sphere 30.
Two files created: 1w0e.pma and 1w0e.stats_init files.
| |
| 3. Run VMD (preferably version 1.8.4 or higher) from the directory
containing the pdb file and load the PDB file.
| |
4. Open tcl console by Extensions -> TK Console and run:
source MOLAXIS_PATH/root/script/molaxis.tcl.
| |
| 5. In the TK Console run MolAxis::view disp_radius 5.
| |
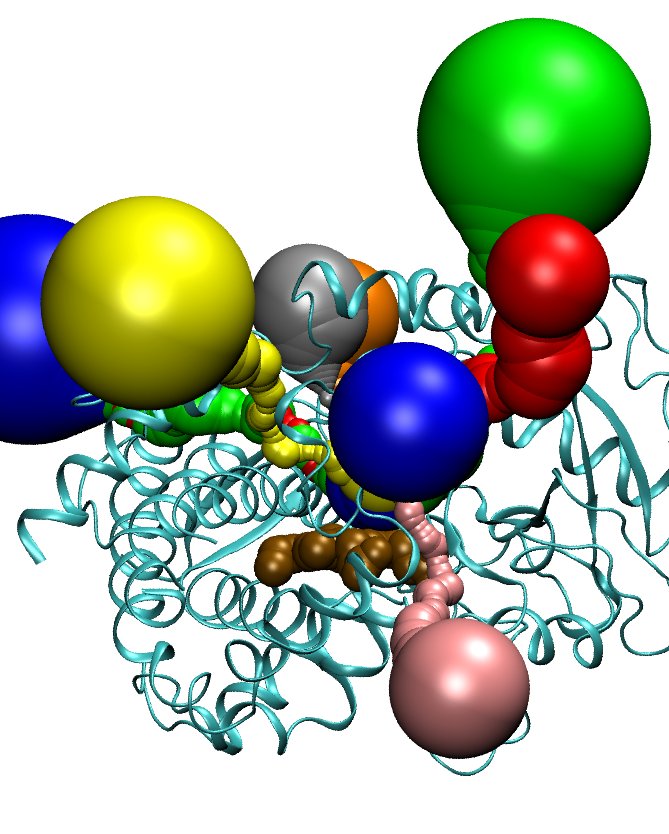
6. Color each pathway in a separate color:
a- In the TK Console run MolAxis::view pw X disp_radius 5 for pathway X.
b- In the command line run: cp 1w0e_tcl.vmd X.vmd.
c- open with a text editor the X.vmd file and change the line
graphics 0 color blue/green/red to a desired color and thus
coloring a channel with a singe unified color.
d- In the TK Console run source X.vmd.
e- Reapeat steps in 6. for channels: 0, 1, 3, 5, 6, 7, 8, 9
and color them blue, red, green, orange, yellow, pink, silver, and iceblue
respectively. The heme is colored brown and represented as VDW.
* You will get a picture similar to the one below.
| |
| 7. For obtaing graphs of each channel: run molaxis graph -pdb 1w0e.pdb
Three files are created: 1w0e.graph_pathway_X 1w0e.graph_pathway_X_bottle
1w0e.graph_pathway_X_all for each pathway.
| |
|
|
 |